Product Updates
We ship fast to help you ship faster
- 🔍 MCP Schedule Search
- 🧠 MCP Smart Data Hints
- 🔐 MCP Client Identification
- 🎯 AI Detect - Fixed Date Range Intelligence
- 💬 Slack Notifications - Dashboard-Level Configuration
- 🌙 Dark Mode - Visual Improvements
- 🔌 MCP (V0)
- 📊 Chart Builder Redesign
- 🔀 Flow Analysis (ClickHouse Support)
- ⏱️ Compare to Previous Period in Funnels
- Cohort Permission Improvements
- Export Capabilities for Admin Users
- UI Enhancements & User Experience
- 📊 Multiple Formulas in Query Reports
- ✨ Refreshed Dashboard Sharing
- 🔔 AI Detection Reset
- 🤖 AI-Powered Derived Fields
- 🤖 Smarter Anomaly Detection
- 📊 Instant Results with Smart Caching
- 🎨 Better Flow Visualizations
- 📊 Breakdown Fields in AI Readiness
- 🎨 Polished Tables & Dictionary Design
- ✨ AI Readiness Experience Upgrade
- 📈 Partial Caching
- 📊 Report Builder Refinements
- 🧠 AI Readiness: Know Where You Stand
- ⚡ Path-to-Flow Conversion Now Preserves All Settings
- 🔄 Flow Analysis: Generally Available.
- 🐛 Currency Symbols in Labels
- 🎨 Refined Report Builder Experience
🔍 Flow Analysis: 2-Step Conversion
Flow Analysis just became a lot more flexible. You can now analyze user journeys with just two steps — down from the previous minimum of three.
What You'll Love Answer your most common journey questions without extra setup. Where do users go right after they hit your paywall? What happens immediately after a key action? Now you configure two steps and get the answer, fast.
Why This Matters Most product questions are about what happens immediately before or after a single moment. Requiring three steps forced workarounds and slowed down exploration. Two-step flows make Kubit faster to use for the questions teams ask every single day.
📊 AI Readiness: Virtual Events and Measures
Your AI Readiness score just got more comprehensive. Virtual events and measures are now fully included in Kubit's AI Readiness assessment.
What You'll Love Import virtual events and measures via CSV, generate AI-powered descriptions and tags with a single click, and see their metadata completeness reflected in the AI Readiness chip — all consistent with the experience you already know for events and fields.
Why This Matters A complete AI Readiness picture requires complete data. Gaps in virtual events and measures meant gaps in your score and blind spots in your data governance. Now your entire data model is covered, enriched, and ready for AI.
🔒 Granular Slack Permissions
Before: Any Kubit user could configure Slack channel destinations for schedules and notifications — including shared channels like #general — a setup that raised flags with enterprise security teams.
Now: A new permission controls who can assign Slack channels, defaulting to Admin and Governor roles. Users without the permission see channels grayed out with a clear tooltip directing them to their Kubit Admin.
The result: Enterprise security teams get the governance controls they need, and Kubit's Slack integration clears the approval process without friction.
🎨 UI Polish: Tables, Charts, and Agent Experience
Before: Several UI rough edges existed across the platform — scrollbars overlapping table headers, elements clipping at container boundaries, chart Y-axis labels misaligning with decimal formatting, and agent UI buttons missing hover states.
Now: This sprint delivers a focused wave of visual polish: scrollbars stay within table bodies, clipping is resolved across key surfaces, chart labels space dynamically with formatting applied, and Lumos Agent buttons use the correct design system styles with full hover and pressed states.
The result: A cleaner, more consistent product feel across the board — fewer moments where the UI gets in the way of the work.
📊 Breakdown Fields in AI Readiness
Before: AI Readiness only counted Filter fields, giving you an incomplete picture of your metadata health.
Now: Breakdown fields appear on the Dictionary Fields page and factor into your AI Readiness score automatically.
The result: A more accurate readiness score that reflects the true state of your data dictionary.
🎨 Polished Tables & Dictionary Design
Before: Tables had undersized buttons, outdated icons, and spacing that felt a bit cramped. The scroll experience on Mac trackpads had a bouncy rubber-banding effect.
Now: Increased row height, updated design system icons, proper sticky headers, refined hover states, and corrected button sizing throughout Dictionary and platform tables.
The result: A cleaner, more professional interface that's easier to scan and navigate.
✨ AI Readiness Experience Upgrade
The AI Readiness panel has been redesigned with a better navigation that highlights exactly where to go when you click an action, and a collapsible completed items section so you can focus on what's left.
We've also implemented hover states, improved spacing, and refreshed typography that round out the experience.
For more information, please read this AI Readiness & AI Data Dictionary article
📈 Partial Caching
Our new Partial Caching is a performance optimization feature designed to speed up query execution, improves dashboard performance and reduce compute costs by reusing results from previous queries.
When you refresh a chart, Kubit now intelligently combines existing cached data with only the most recent "delta" from your warehouse, ensuring faster load times without sacrificing data freshness.
📊 Report Builder Refinements
Before: Range binning controls were unintuitive, charts didn't adapt to window resizing, and the builder panel lacked smooth collapse controls.
Now: We have a cleaner range binning configuration, responsive chart containers that adapt to your screen, and polished builder panel controls with intuitive collapse and close behavior.
The result: A faster, more comfortable report building experience that lets you focus on the analysis, not the tool.
🧠 AI Readiness: Know Where You Stand
Our new AI Readiness Chip gives you instant visibility into how prepared your data model is for Kubit's AI powered analytics. See your readiness score right from the AI screens and know exactly what to do next.
What You'll Love: The readiness chip appears on the Lumos AI Chat and Data Dictionary screens so you always know your current status. Dictionary updates now feed directly into your readiness score, and the chip clearly shows which improvements will have the biggest impact. AI generated synonyms for your data fields mean the AI understands your data better with less manual effort.
Why This Matters: Getting the most from AI analytics requires a well prepared data model. The AI Readiness Chip removes the guesswork, giving your team a clear roadmap to unlock the full potential of Kubit's AI capabilities.
For more information, please read this AI Readiness & AI Data Dictionary article
⚡ Path-to-Flow Conversion Now Preserves All Settings
Converting Path reports to Flow? Every setting now carries over perfectly!
Converting your Path Analysis reports to Flow now perfectly preserves all your settings including direction, subject, flow adjustments, and advanced configurations. No more manual reconfiguration after conversion.
Click convert, and you're done - identical analysis in the new format. For more guidance, please follow this Migration Guide to help you transition
🔄 Flow Analysis: Generally Available.
Path Analysis creation is now disabled. Flow Analysis has officially graduated from beta and is your new standard for journey visualization
Existing Path reports remain fully accessible and functional. Flow Analysis delivers the same insights with improved performance and a cleaner interface.
What You'll Love Flow Analysis handles all your journey visualization needs with better visual clarity and capabilities.
Why This Matters Flow Analysis represents the evolution of user journey visualization in Kubit.
Transition Timeline: Path Analysis will deprecated on February, 26th. Please make sure to migrate your Path Report to Flow Analysis. For more information, follow this Migration Guide to help you transition.
🐛 Currency Symbols in Labels
Before: Custom format '$' symbols disappeared from bar chart labels even when space was available.
Now: Currency symbols display properly on bar labels, with intelligent truncation only when necessary.
The result: Your financial charts show the formatting you configured without mysterious symbol disappearances.
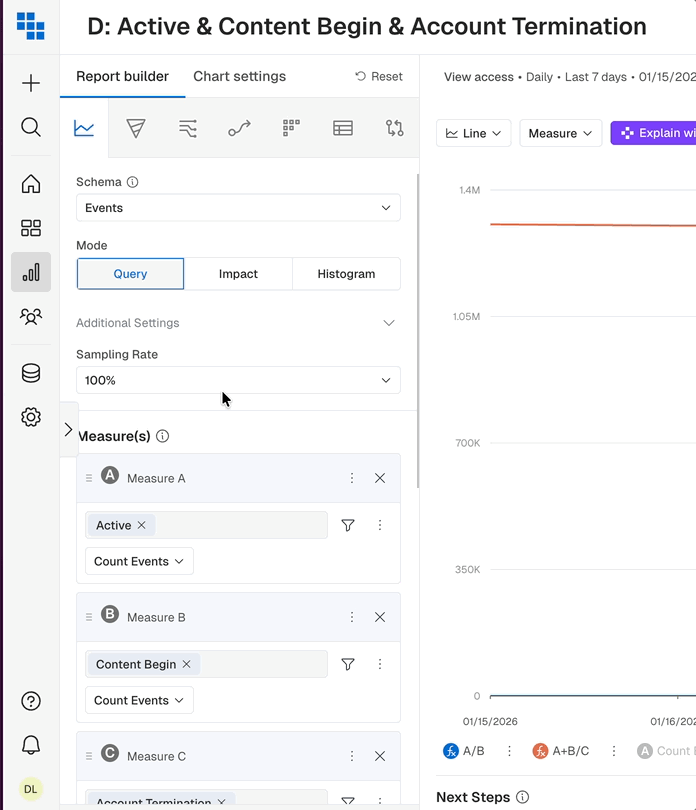
🎨 Refined Report Builder Experience
The Report Builder has undergone a comprehensive interface update with improved spacing, consistent interactions, and smarter behavior.
What’s New:
- Additional Settings now intelligently expand when you make changes and collapse when you navigate away without modifications.
- Chart Settings accordions provide clear hover feedback.
- Next Steps appear as compact buttons that don't demand attention.
The result: Less scrolling, clearer visual hierarchy, and an interface that adapts to how you actually work. More room for your charts without sacrificing builder functionality.
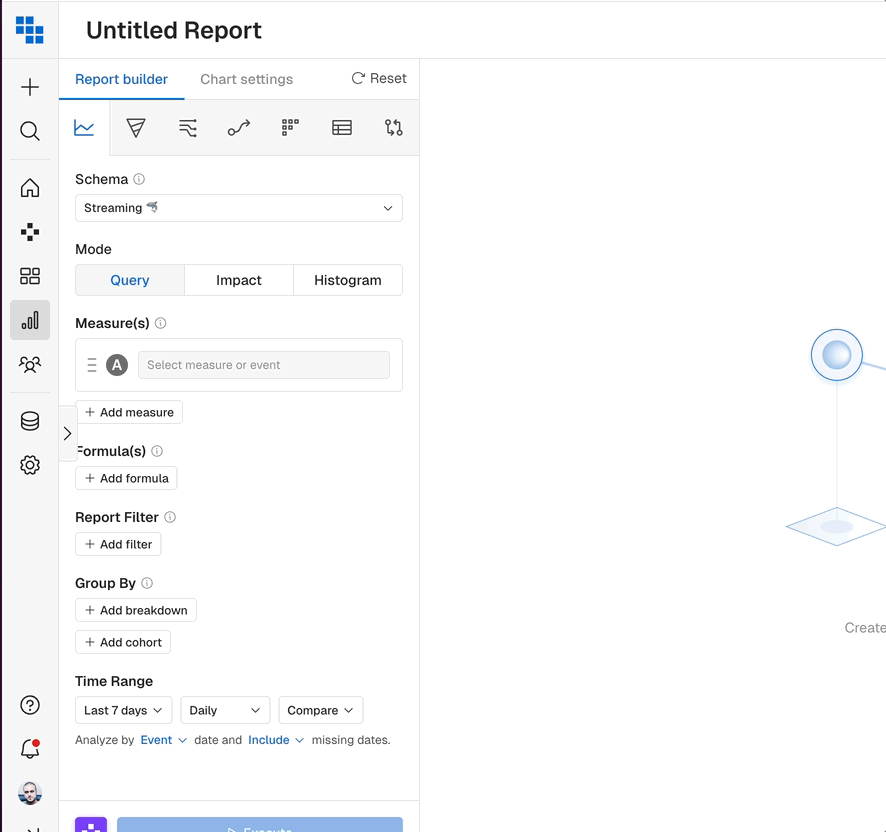
Refreshed Report Builder Interface
We’ve overhauled the Report Builder’s interface, introducing a cleaner styling and consistent look across all sections.
What’s New:
- Unified Design: The Measures and Formulas sections now feature a cohesive aesthetic with properly aligned icons and matching interactions.
- Intuitive Layout: Tooltips are more strategically placed, where
Additional Settingshave been streamlined to maximize your workspace. - Refined Details: Every visual element has been sharpened to make navigation feel more instinctive and fluid. From standardizing button sizes, rounded tab corners to clear blue highlights for active selections, and responsive hover effects — all of which provide immediate visual feedback.
This leads to less cognitive load and faster report building allowing you to stay focused on your data.
🤖 Lumos Workflow improvement
Before: Previously, Lumos AI prompt box would close automatically when you interact with the builder, forcing you to constantly reopen it while referencing event names, properties, or filter values.
Now: Now you can interact with event names in the dropdown, check property values in filters, and explore your report builder without the Ask Lumos panel disappearing on you.
The Result: The prompt box stays exactly where you left it until you are ready to execute.
📢 Heads Up: Path Analysis Transition
Reason: We are sunsetting Path Report and introducing Flow as the standard user journey report in Kubit. Flow Analysis offers the same insights with better performance and visualization.
Transition Plan: Prominent deprecation banner has been added to the Path Analysis chart interface to inform users for the upcoming changes. Banner communicates:
- All users should migrate to Flow Analysis. Please follow this Migration Guide to help you transition.
- Starting February 12th, you won’t be able to create new Path Reports. However, you can still view your current reports until February 26th.
- Path Analysis will deprecated on February, 26th
Flow advantages:
Unlike Path, Flow includes a dedicated "Drop-off" node at every step, showing exactly where users quit the journey.
Flow Report gives you the power easily toggle between Unique and Total occurrences to distinguish between broad behavior and high-frequency actions.
Cohort Permission Improvements
Before: Users with Edit Cohort permissions but without Create Cohort permissions were blocked from saving cohorts or inspecting users from report breakdowns, even though these actions should be allowed.
Now: Permission handling now properly separates Save Cohort from Update existing cohort actions. Users with edit permissions can now update existing cohorts and inspect users without needing full create permissions.
The Result: Users with "Edit Cohort" permissions can now successfully update existing cohorts and access report breakdowns independently of "Create" permissions
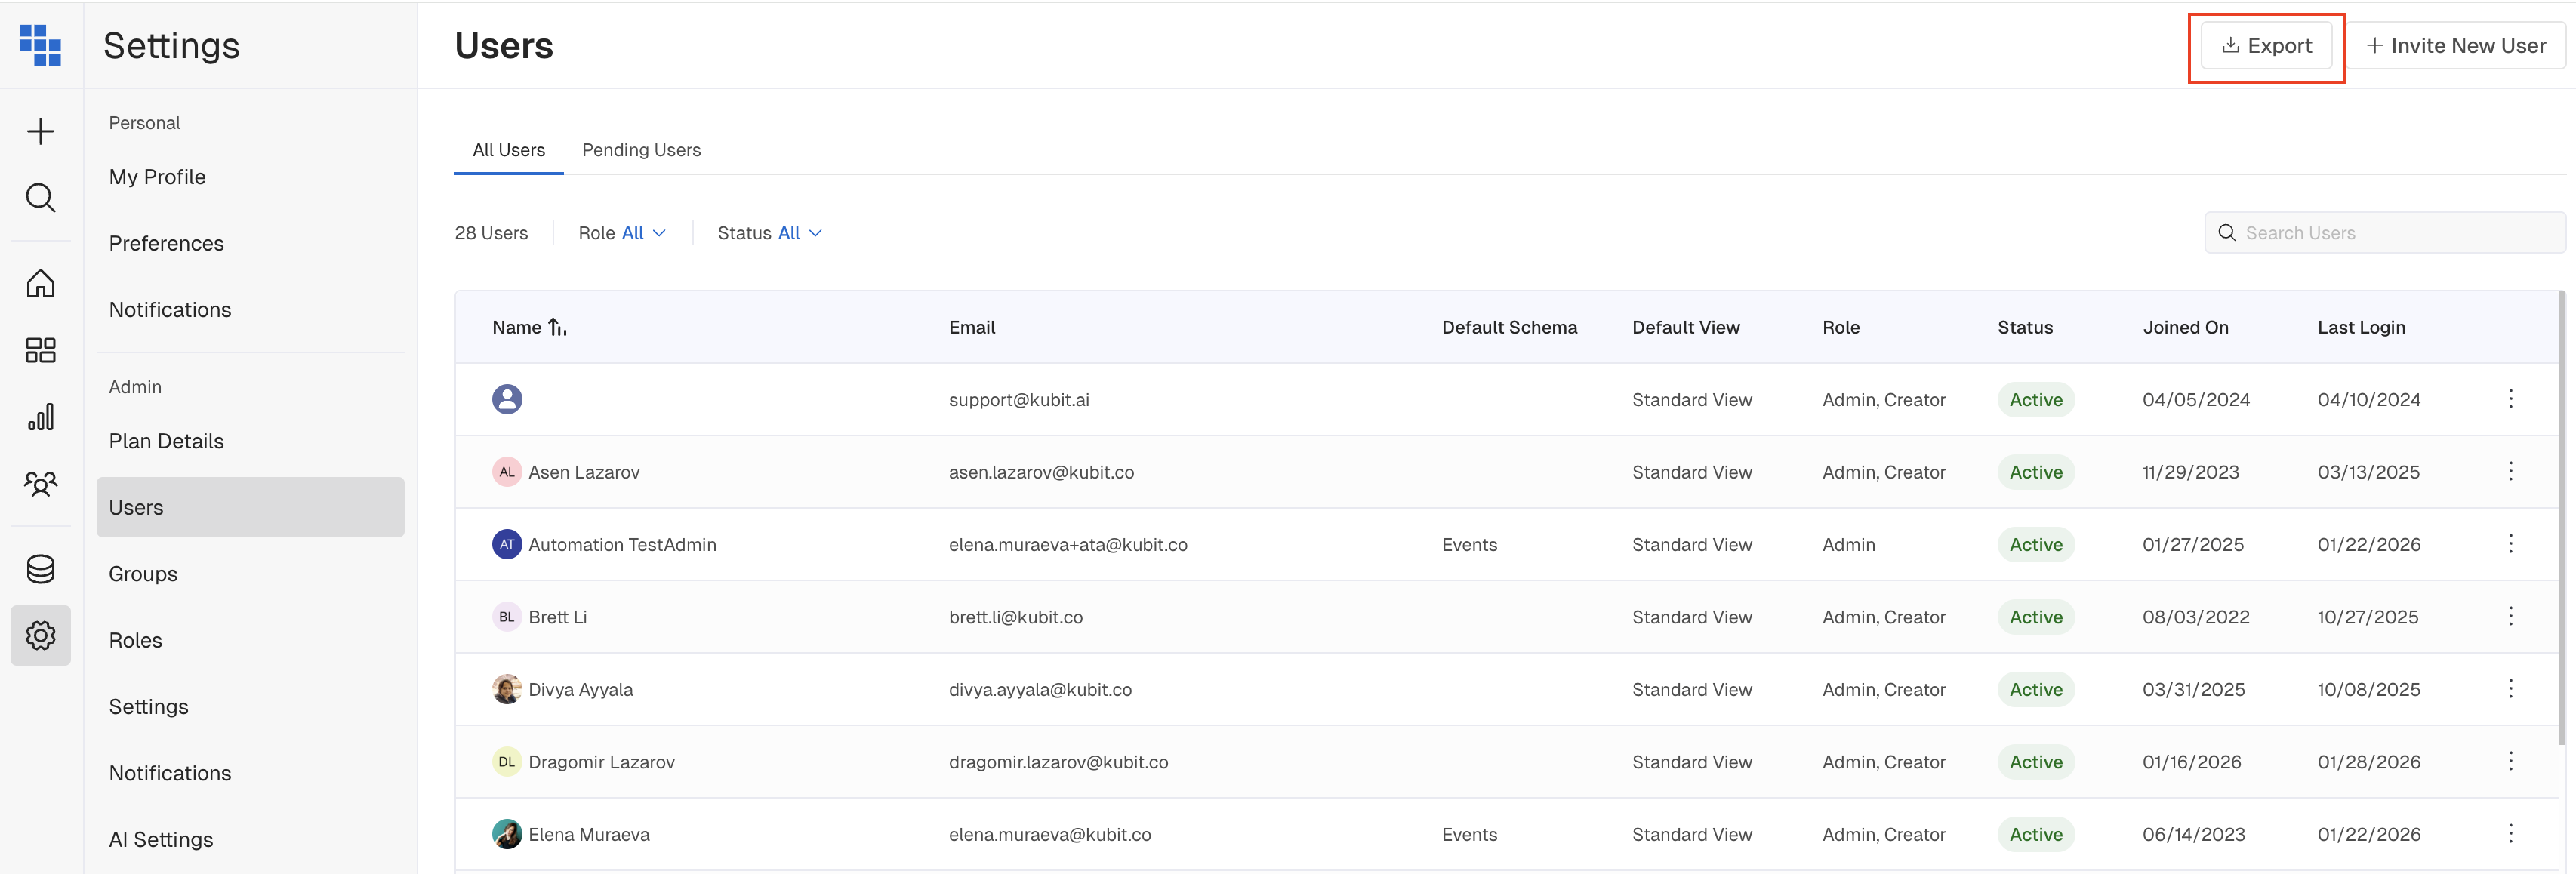
Export Capabilities for Admin Users
You can now export data from Users, Groups, Roles, Schedules, and Incidents tables directly to CSV, making it easy to create audit trails, share with stakeholders, or integrate with external tools.
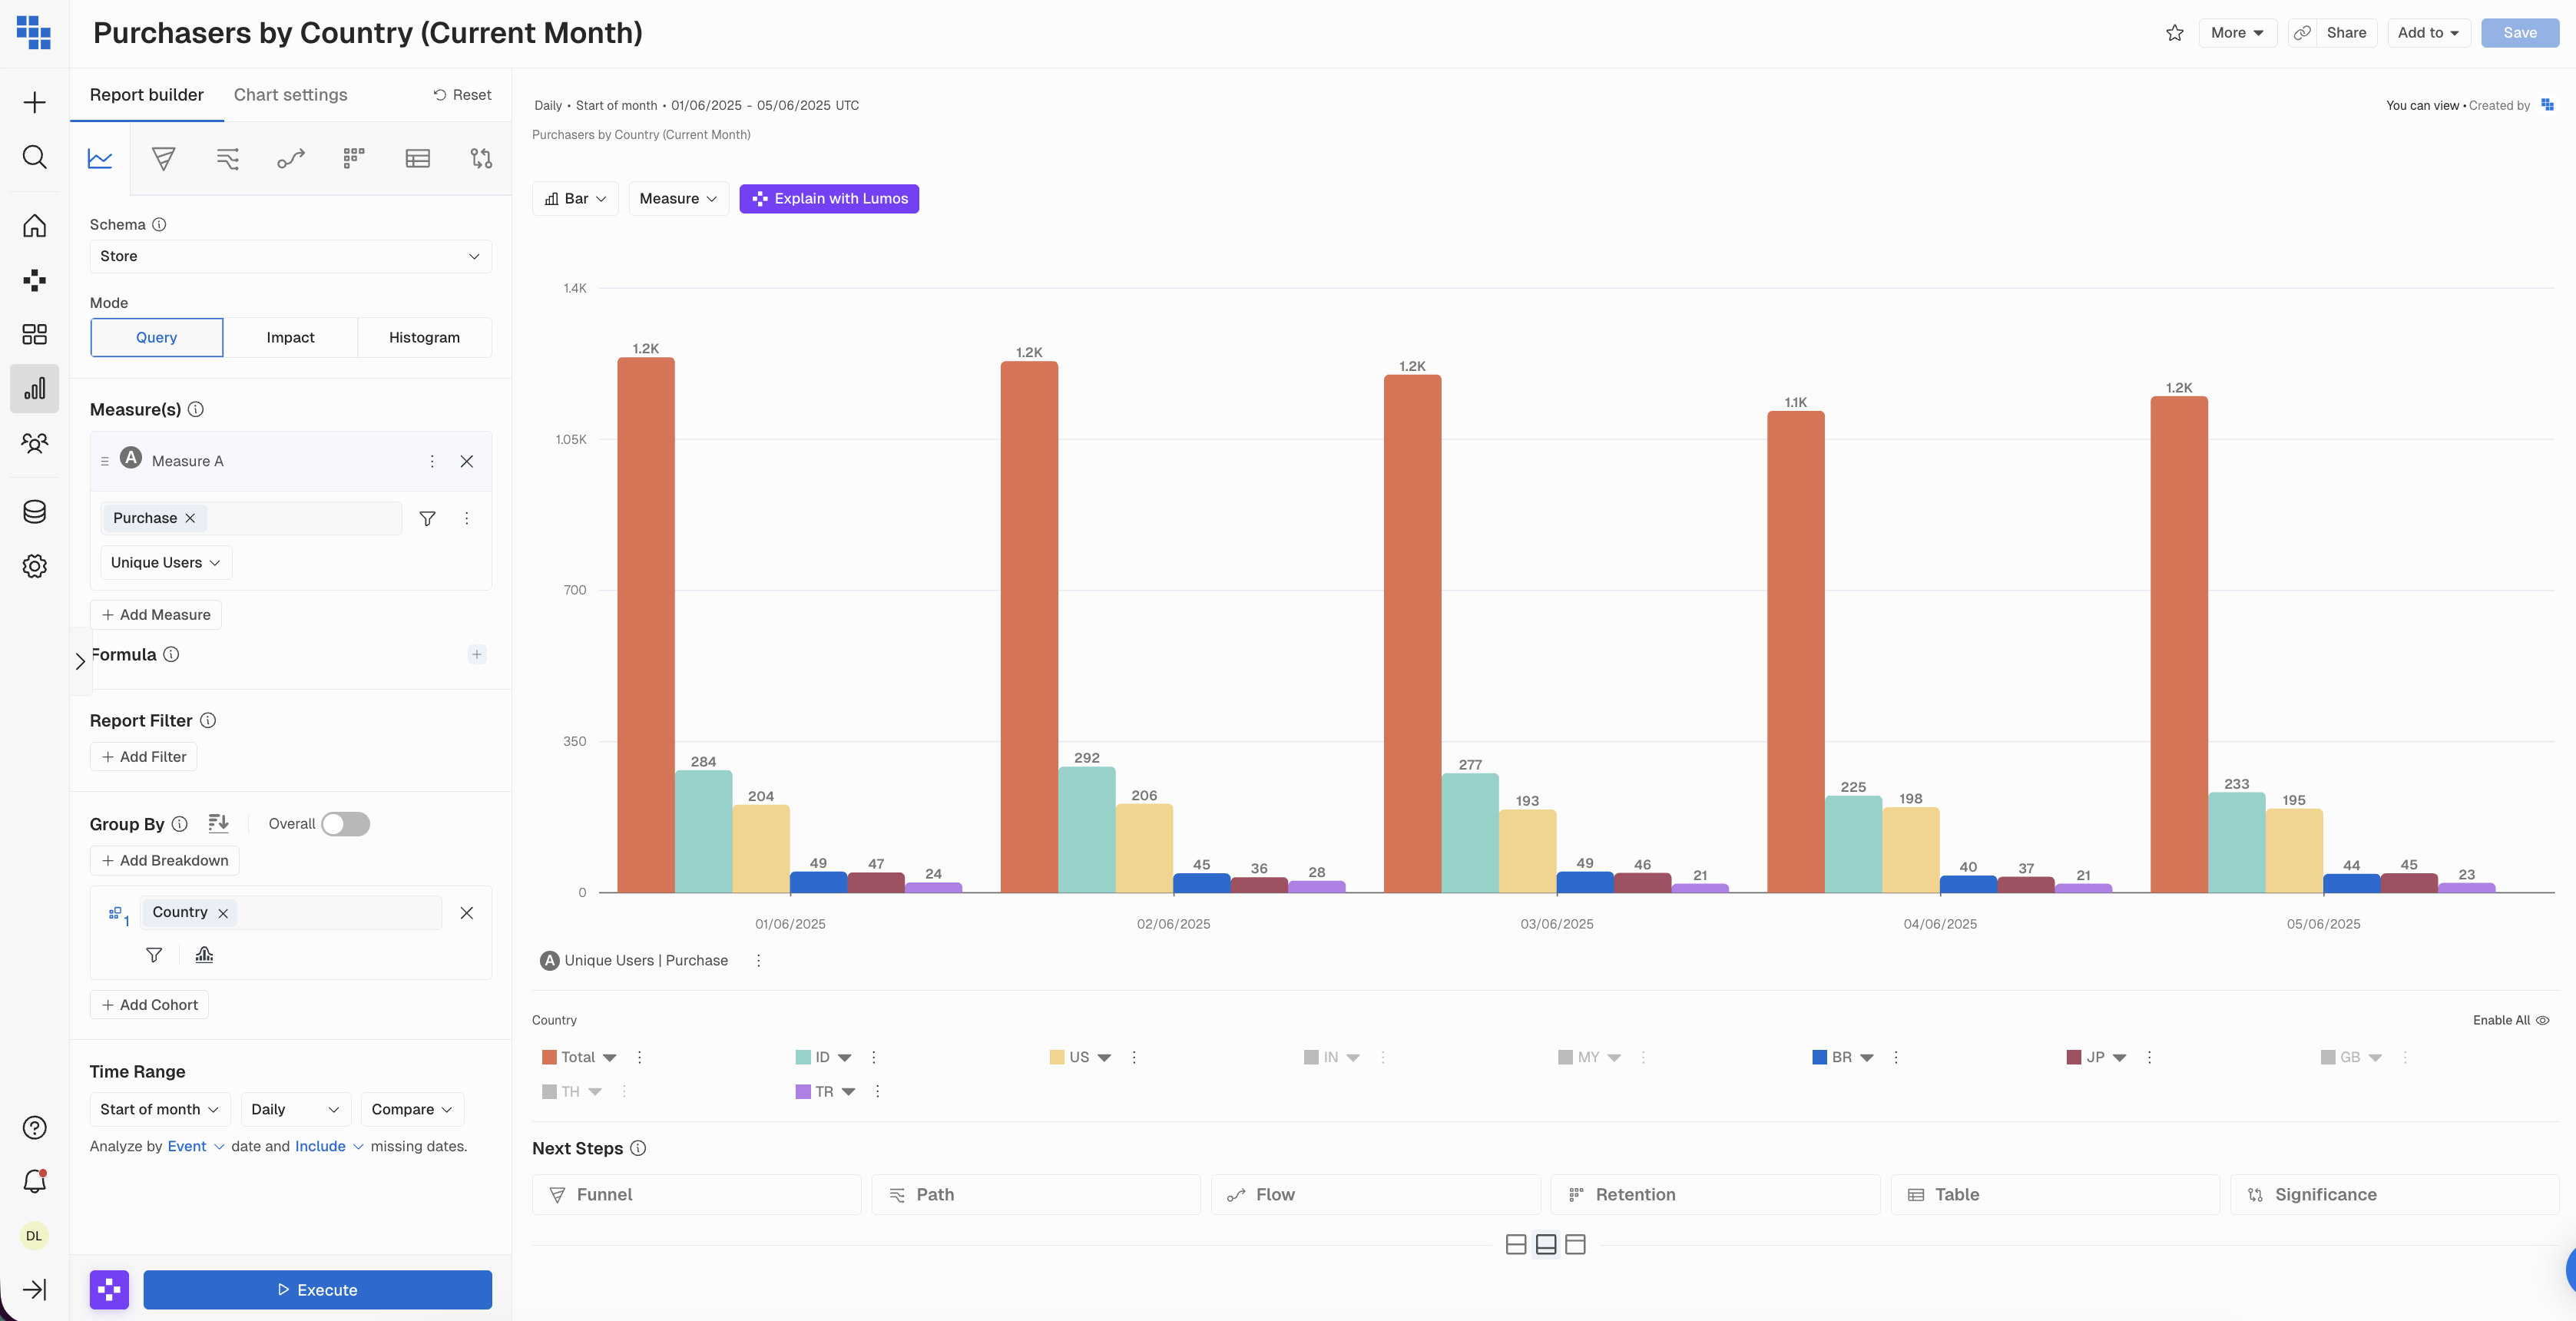
UI Enhancements & User Experience
Before: Charts weren't responding well to different screen sizes, resulting in cutting off content.
Now: Charts now utilize dynamic scaling and responsive containers across different displays, from laptops to large monitors.
The result: Ensuring all content is visible including labels, legends, and data points. Better visibility of complex charts and large data tables. Reduced need for scrolling.
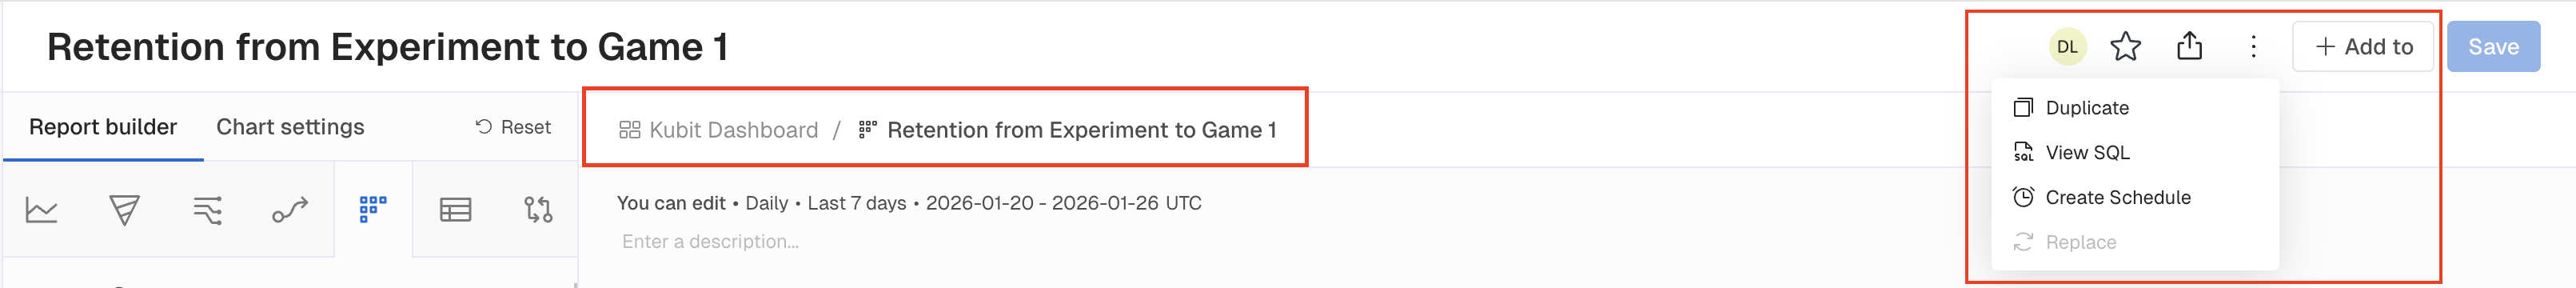
Before: Report & Dashboard headers needed improved information density and cleaner visual hierarchy due to inconsistency with modern UI patterns.
The result: The redesigned sticky header moves the report description into view and simplifies action buttons into cleaner icon-based controls. You can now navigate, favorite, and share reports faster with less visual clutter.
Before: When clicking the filter icon while scrolled down on a dashboard, users had to manually scroll back up to see the filter panel.
The Result: Clicking the filter icon now automatically scrolls the page to the top, so you can immediately start working with your filters without extra navigation.
Before: Dropdowns with input fields (like Sampling Rate) stayed open while scrolling the builder, creating visual confusion and potential misclicks
The result: All dropdowns now close consistently when you scroll, keeping the interface clean and predictable.