Product Updates
We ship fast to help you ship faster
- 🔍 MCP Schedule Search
- 🧠 MCP Smart Data Hints
- 🔐 MCP Client Identification
- 🎯 AI Detect - Fixed Date Range Intelligence
- 💬 Slack Notifications - Dashboard-Level Configuration
- 🌙 Dark Mode - Visual Improvements
- 🔌 MCP (V0)
- 📊 Chart Builder Redesign
- 🔀 Flow Analysis (ClickHouse Support)
- ⏱️ Compare to Previous Period in Funnels
- Cohort Permission Improvements
- Export Capabilities for Admin Users
- UI Enhancements & User Experience
- 📊 Multiple Formulas in Query Reports
- ✨ Refreshed Dashboard Sharing
- 🔔 AI Detection Reset
- 🤖 AI-Powered Derived Fields
- 🤖 Smarter Anomaly Detection
- 📊 Instant Results with Smart Caching
- 🎨 Better Flow Visualizations
- 📊 Breakdown Fields in AI Readiness
- 🎨 Polished Tables & Dictionary Design
- ✨ AI Readiness Experience Upgrade
- 📈 Partial Caching
- 📊 Report Builder Refinements
- 🧠 AI Readiness: Know Where You Stand
- ⚡ Path-to-Flow Conversion Now Preserves All Settings
- 🔄 Flow Analysis: Generally Available.
- 🐛 Currency Symbols in Labels
- 🎨 Refined Report Builder Experience
✏️ Inline Cohorts - Workflow Improvements
Previously, editing a Cohort and hitting Update saved a temporary cohort rather than updating the existing one. We've improved this workflow with three distinct options.
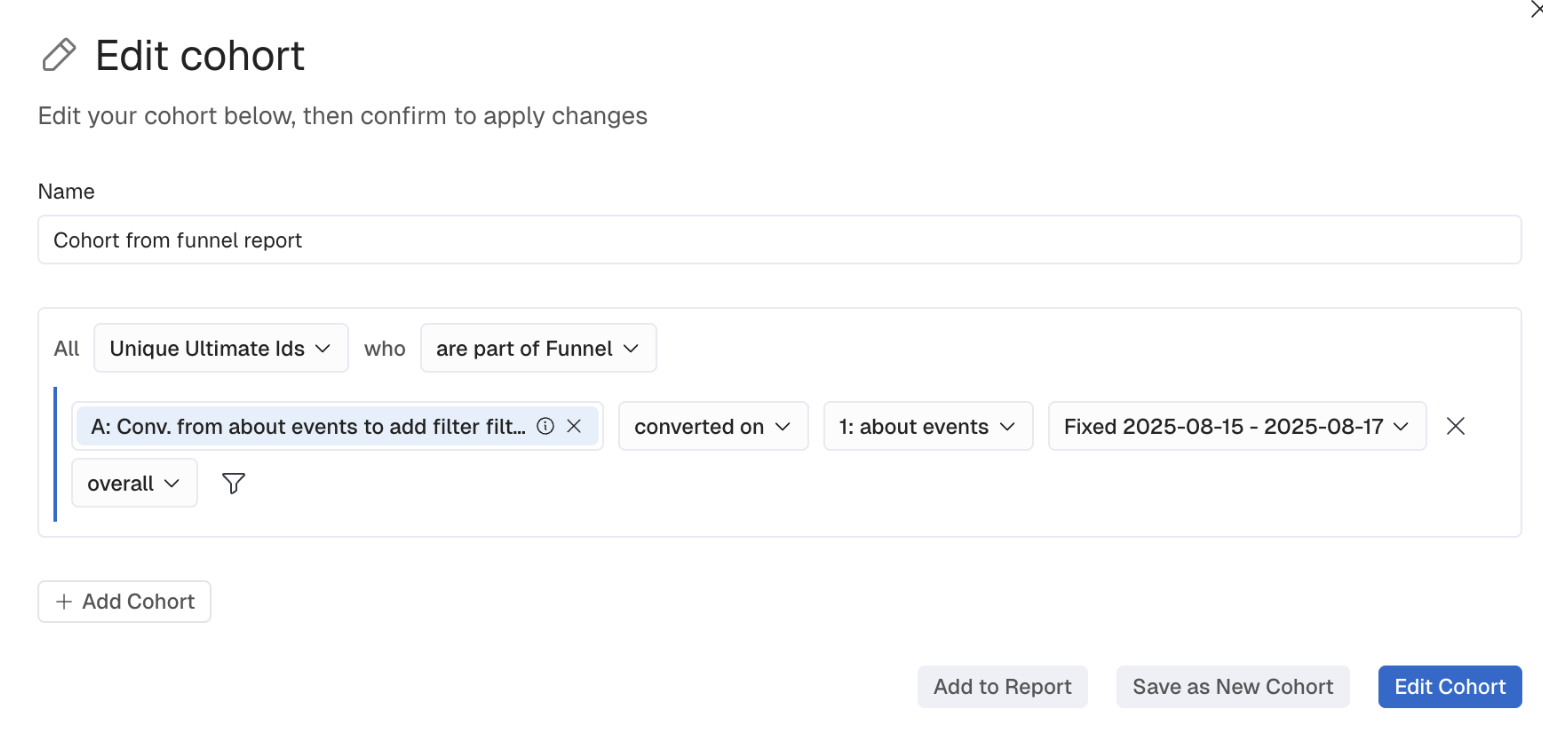
The result: No more accidental creation of temporary cohorts. Clear control over how your changes are saved.
📊 Bar Chart Enhancements
Improvements to the user experience when creating bar charts, including zoom capabilities and improved responsiveness.
Zoom in on dense data for detailed analysis. Smooth interactions when resizing windows. Better analysis of complex bar chart data across different screen sizes.
👥 Cohort Workflow Improvements
When creating Report, you can now define Compound Cohorts with full functionality directly from the Report Builder, including complex AND/OR logic.
What You'll Love
Build complex multi condition cohorts without leaving your report workflow. Save them for reuse instantly. The same filtering and segmentation capabilities as standalone cohort creation.
Why This Matters
Faster report building with integrated cohort creation. Consistent capabilities regardless of where you create them. Streamlined workflow for ad hoc analysis.
📋 Table Header Enhancement
Frozen headers and columns with independent scrollbars for every table view.
Scroll vertically while headers stay visible. Scroll horizontally while the first column stays frozen. Navigate large tables without losing context. Better usability for data heavy reports.
📈 Line Chart Settings Improvements
We've improved Chart Settings with a new Appearance menu that allows extensive customization of line charts in Query and Funnel reports.
What You'll Love
Show or hide the rank of breakdown values. Set Line Style as Straight or Smoothed. Set Dot Style as Hidden, Filled, or Outlined. Show or hide X and Y grid lines, and make them dashed or solid.
Why This Matters
More professional charts aligned with your preferences. Better readability through customizable details. Flexibility to match visualization style to your audience.
📝 Report Drafts
The Drafts feature provides a persistent, session-independent way to retain unfinished report work. Drafts are automatically saved when you begin creating or editing a Report without executing it.
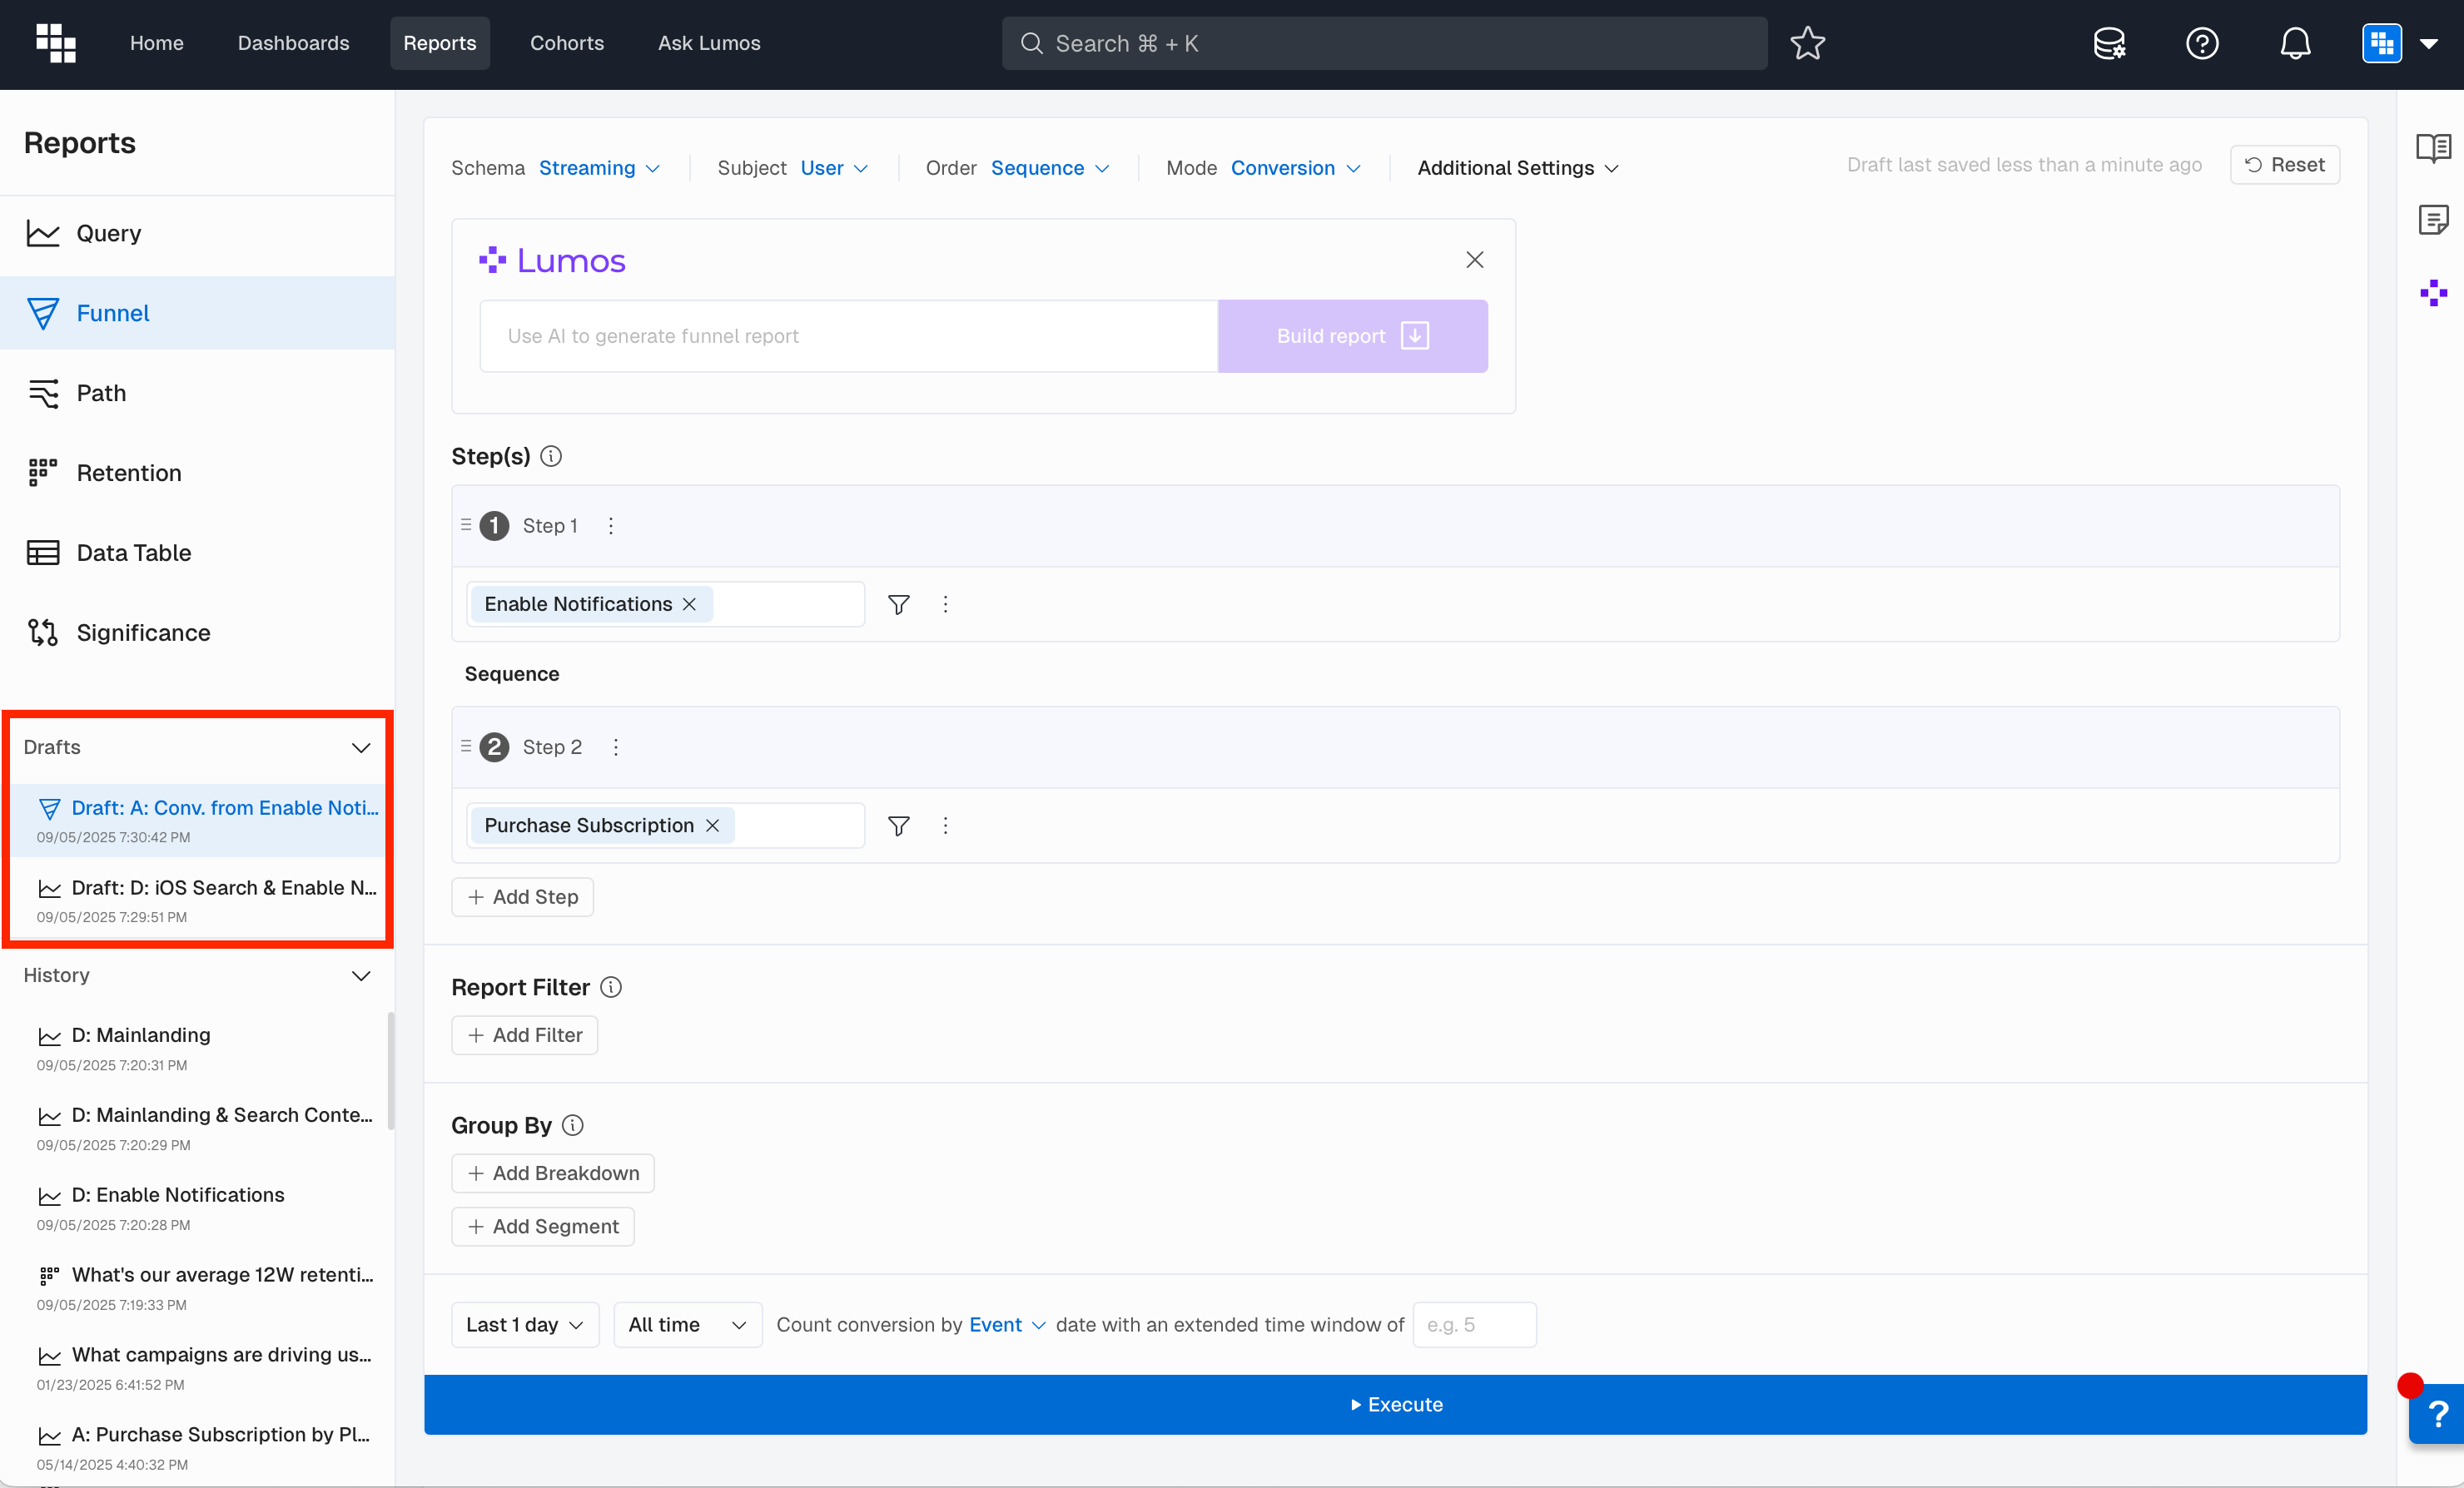
What You'll Love
Access your drafts at the top of History. Maintain up to 10 recent drafts that persist across sessions. Even if you close your browser or log out, your work is waiting for you.
Why This Matters
No more lost work from accidental navigation. Better workflow continuity when you need to step away and come back later.
🙈 Hide "Others" on Stacked Charts
When breaking down by high-cardinality fields, the Others group can dominate your stacked chart. You can now hide it to focus on specific segments.
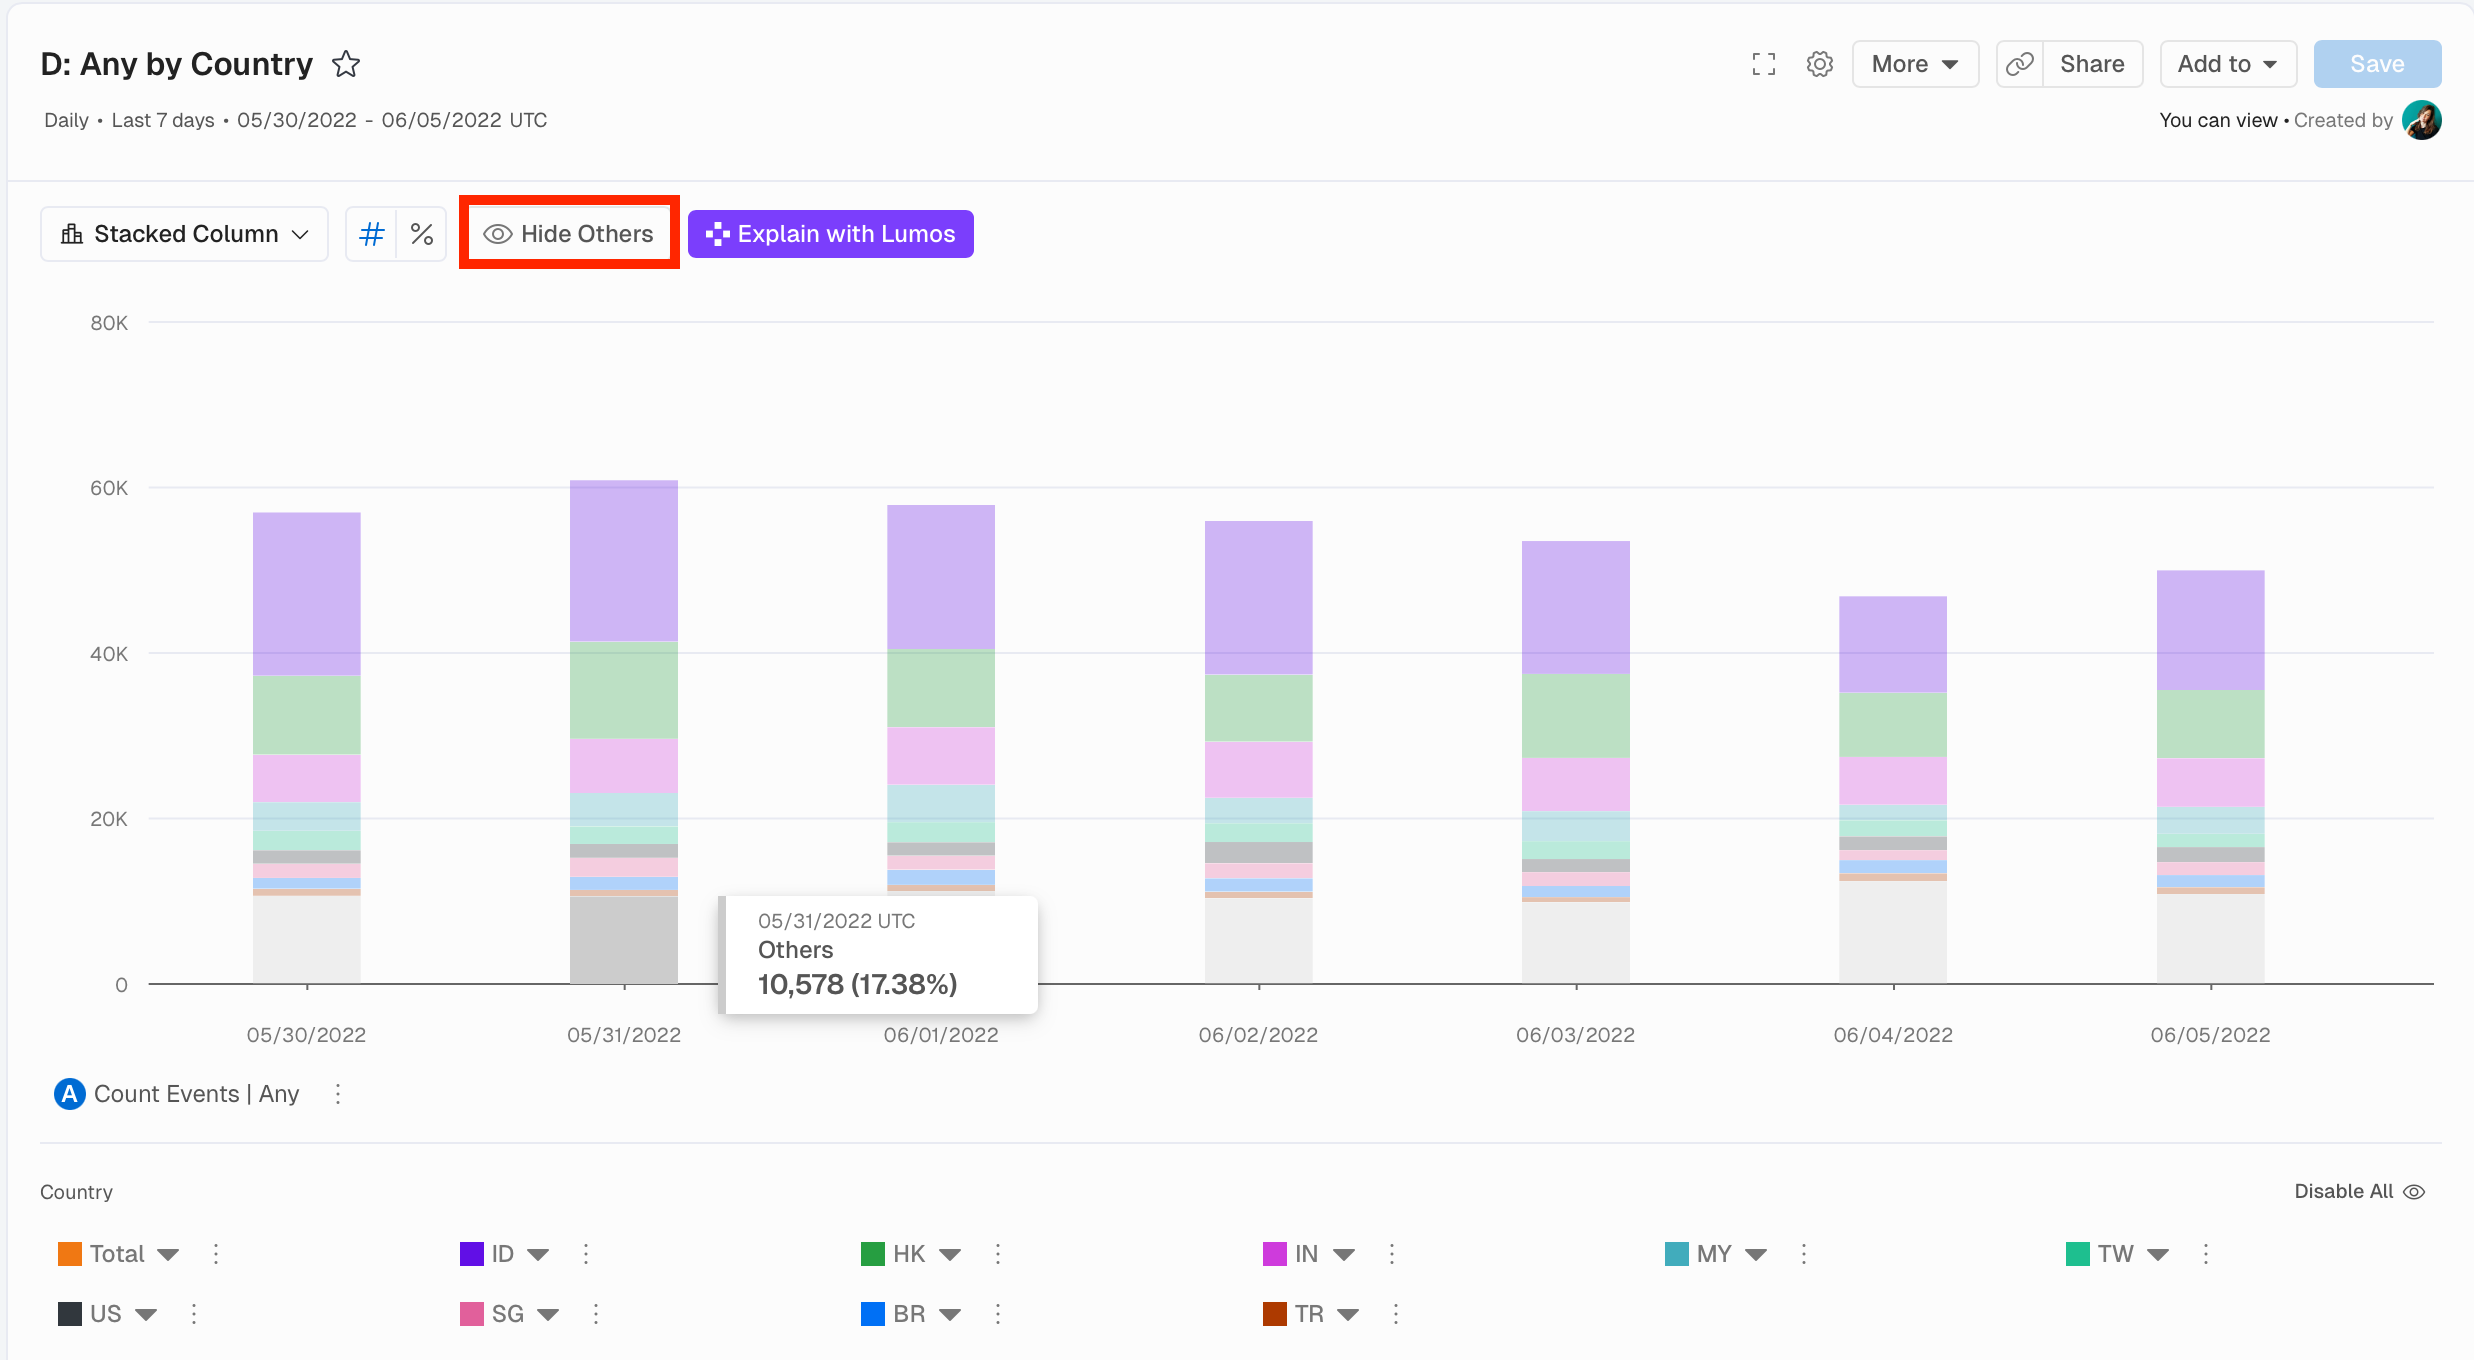
What You Can Do Now
- Click
Hide Othersto remove the Others group from stacked charts - See percentages calculated based only on visible segments
- Focus analysis on specific Breakdown groups
What Impact Does This Have
- Clearer analysis of specific segments without noise
- Adjustable percentage calculations for focused analysis
- Better storytelling when presenting specific data subsets
🔍 Zoom-in and Out
When viewing Charts with multiple Breakdown groups, you can now zoom in on specific time periods to see the distribution during that time.
How It Works
Left-clicking on any data point reveals a Zoom-in option. Selecting it filters the view to that specific time period, showing the distribution breakdown. The zoom level depends on your Report's Time Unit setting.
What Impact Does This Have
- Deeper analysis of specific time periods
- Better understanding of distribution patterns at granular levels
- Flexible exploration without creating new Reports
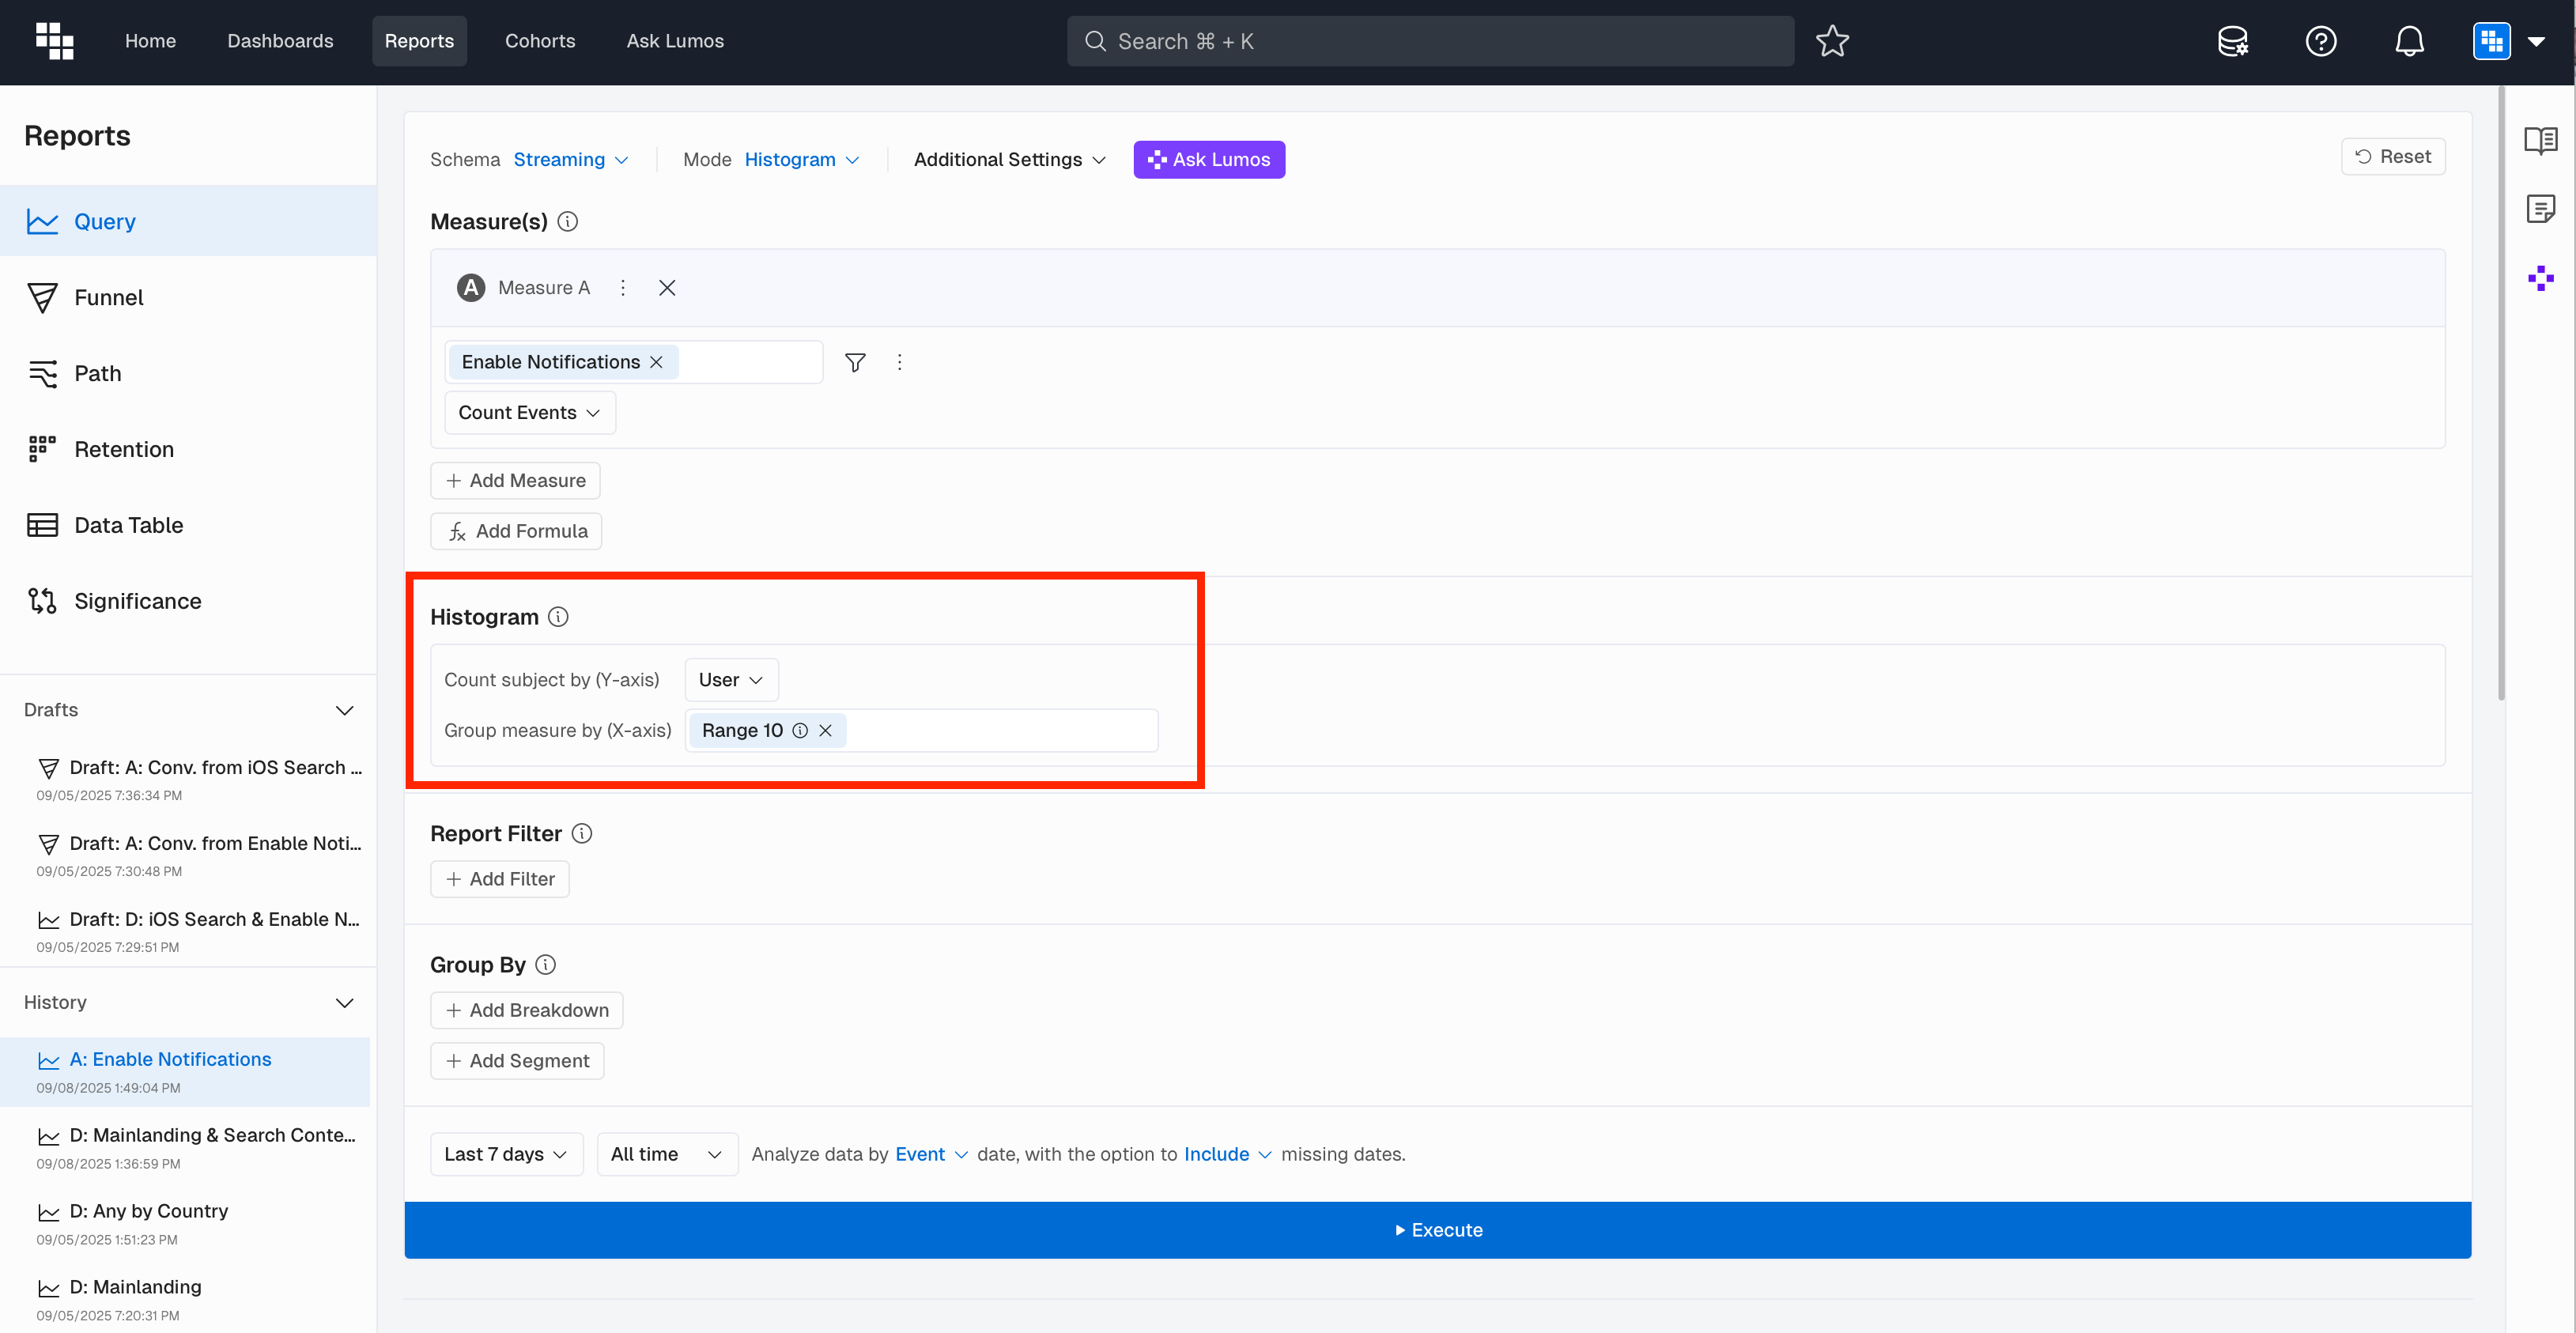
📊 Histogram Enhancement
🔧 Measure Builder Updates
We've streamlined the Measure building experience in Query and Data Tables with a new workflow that starts with your Event and ends with how you want to measure it.
What You'll Love
Start by picking your Event, add filters or additional Events, then specify how to measure. Rolling options now appear directly in the Measure By dropdown. A logical sequence that matches how you think.
Why This Matters
More intuitive measure creation. Fewer clicks for common configurations. Rolling Measures are finally easy to find.
📈 Compound Rolling Measures
You can now add multiple Rolling Measures and create Compound Rolling Measures for advanced metrics like DAU/WAU % and DAU/MAU %.
How It Works
Add multiple Rolling Measures to your Report, then use the Compound Measure feature to divide one by another. For example, Rolling 7-day Average of Unique Users divided by Rolling 30-day Window of Unique Users creates a DAU/MAU ratio.
📋 Funnel - Ability to Duplicate Steps
When building complex Funnel steps, you can now duplicate them to save time on subsequent steps that need similar Event or Filter configurations.
💬 Lumos Explain in Chat
After asking a question with Lumos, you can now have AI explain the results with configurable summary options:
What You'll Love
Click Explain with AI after results populate. Toggle Executive summary, Key insights, Summary statistics, and Recommendations on or off. Click Retry to change your configuration for subsequent questions.
Why This Matters
- Faster insight extraction from complex results.
- Customizable explanations for different audiences.
- Reduced time from data to actionable insights.
🚨 Create Custom Incidents
Go beyond the out of the box Incident Type options. You can now create custom Incidents from data points or the Incidents screen. Custom types become available for future Incident creation which makes it possible to align incident tracking with your organization's terminology.
👁️ Hide/Show All Breakdown Groups
Within Breakdowns, you can now toggle between having all groups Enabled or Disabled for focused analysis.
Before: To focus on specific Breakdown groups, you had to disable them one by one.
Now: Toggle between having all groups Enabled or Disabled with a single click. Disable specific groups to remove them from view, then re-enable all instantly.
The result: Faster focusing on specific data segments. Easy comparison between selected groups.
📤 Download Dashboard to Google Slides
You can now download specific reports from a Kubit Dashboard directly into a Google Slides file on your Google Drive. Each report will be on its own slide and you also have the option to download individual PNG files. The files land automatically in your Google Drive root folder.
What Impact Does This Have
- Faster presentation creation from Kubit insights
- Consistent visual format for stakeholder presentations
- Seamless integration with existing Google Workspace workflows
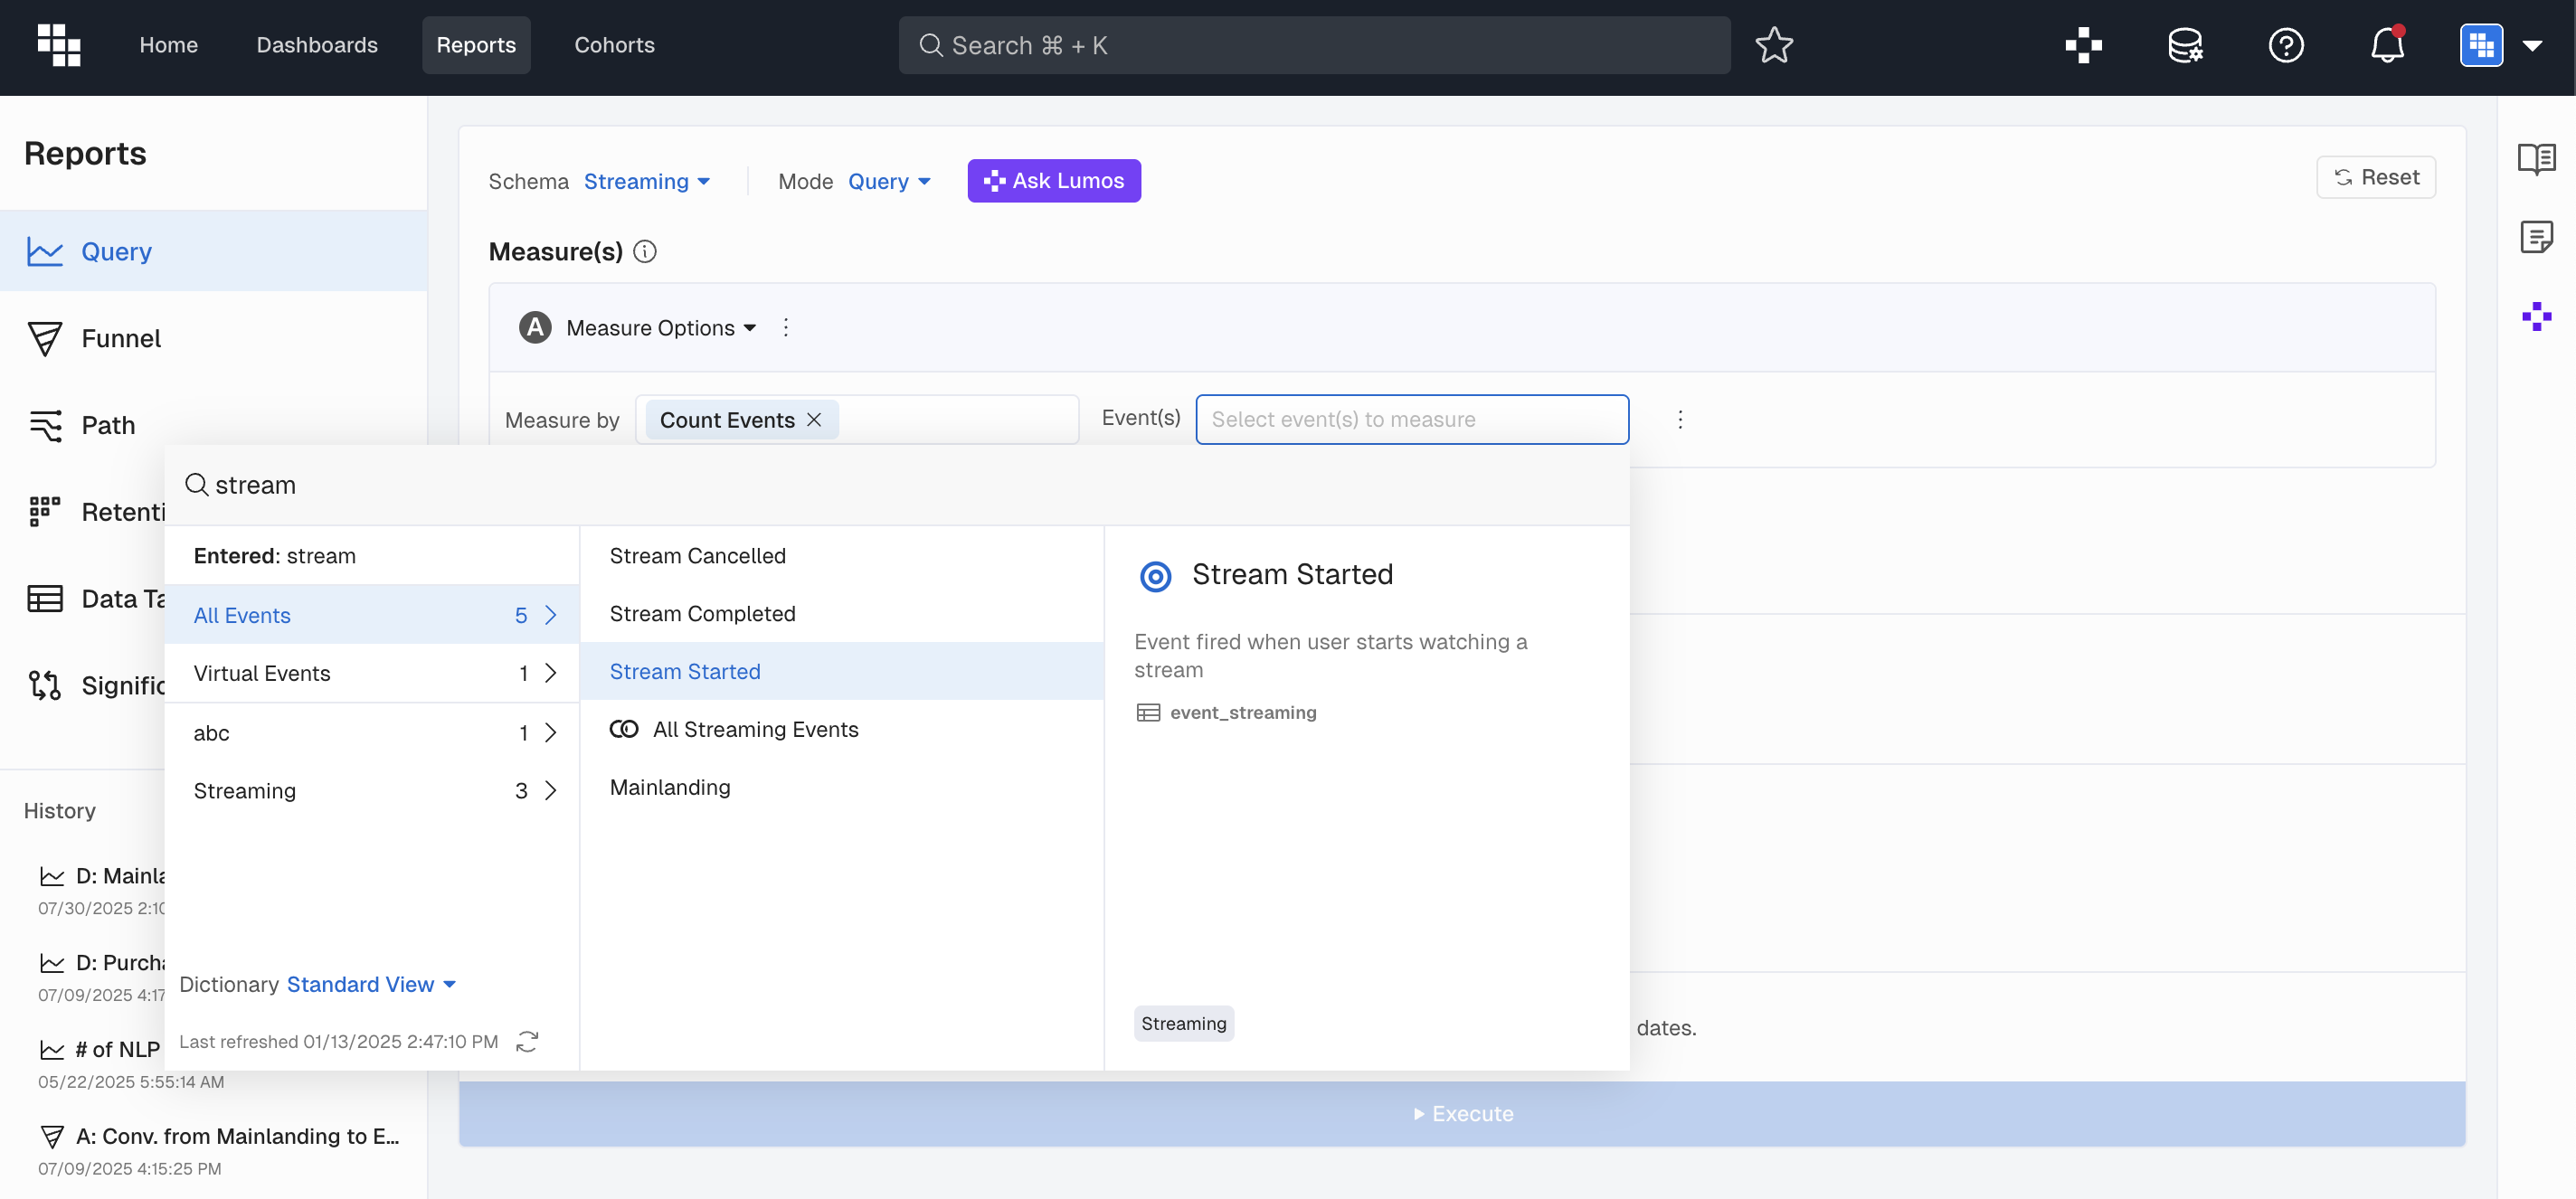
🔍 Search in Report Builder
📋 Ability to Duplicate Measures
When building Measures, you can now duplicate existing Measures to save time when creating similar variations.
What You Can Do Now
- Duplicate any Measure you've built
- Make small adjustments to the duplicate
- Build variations faster (e.g.,
Count of Events→Unique Usersof same Events)
How It Works
When a Measure is selected, a Duplicate option appears. Clicking it creates a copy of the measure configuration, which you can then modify as needed.
What Impact Does This Have
- Faster report building with similar measures
- Reduced errors from manual recreation
- More time for analysis, less for configuration